Actualité climatique du mois passé dans laquelle j'entrepose pêle-mêle les articles que j'ai trouvés intéressants (mais j'ai pu, et dû, en louper un certain nombre) ; les articles ne sont pas traduits en français, à chacun donc de se débrouiller avec la langue de Shakespeare en fonction de ses capacités (il y a au demeurant des outils de traduction en ligne assez performants...) ; cependant vous pouvez aussi utiliser l'outil de traduction que Blogger met à votre disposition et que vous trouverez dans le bandeau de droite. Sélectionnez d'abord l'anglais si le français n'apparait pas, le texte sera alors intégralement traduit en anglais ; il vous suffira alors de sélectionner le français et tout le texte sera intégralement traduit en français.
*****
Le 22 mars 2018 : Increase in extreme precipitation events under anthropogenic warming in India
Abstract
India has witnessed some of the most devastating extreme precipitation events, which have affected urban transportation, agriculture, and infrastructure. Despite the profound implications and damage due to extreme precipitation events, the influence of anthropogenic warming on the intensity and frequency of extreme precipitation events over India remains poorly constrained. Here using the gridded observations and simulations from the Coupled model intercomparison project 5 (CMIP5) and Climate of 20th century plus (C20C+) detection and attribution (D&A) project, we show that the frequency and intensity of extreme precipitation events have increased in India during the last few decades. Along with the extreme precipitation, dew point temperature has also increased during 1979–2015. The scaling relationship between extreme precipitation and dew point temperature shows a super (more than 7% increase per unit rise in dew point temperature) Clausius-Clapeyron (C-C) relationship for the majority of south India. Moreover, southern and central India show a higher (10%/°C) scaling relationship than north India (3.5%/°C). Our analysis using the Hist (historic) and HistNat (historic natural) simulations from the CMIP5 and C20C+ projects confirms an increase in the frequency of extreme precipitation events under the anthropogenic warming. Moreover, we show that 1–5 day precipitation maxima at 5–500 year return period increases (10–30%) under the anthropogenic warming. The frequency of precipitation extremes is projected to rise more prominently in southern and central India in the mid and end of the 21st century under the representative concentration pathway (RCP) 8.5. Our results show a significant contribution of anthropogenic warming in the rise of the frequency of extreme precipitation, which has implications for infrastructure, agriculture, and water resources in India.
*****
Le 13 avril 2018 :
A 400‐Year Ice Core Melt Layer Record of Summertime Warming in the Alaska Range
https://agupubs.onlinelibrary.wiley.com/doi/abs/10.1002/2017JD027539
Abstract
Warming in high‐elevation regions has societally important impacts on glacier mass balance, water resources, and sensitive alpine ecosystems, yet very few high‐elevation temperature records exist from the middle or high latitudes. While a variety of paleoproxy records provide critical temperature records from low elevations over recent centuries, melt layers preserved in alpine glaciers present an opportunity to develop calibrated, annually resolved temperature records from high elevations. Here we present a 400‐year temperature proxy record based on the melt layer stratigraphy of two ice cores collected from Mt. Hunter in Denali National Park in the central Alaska Range. The ice core record shows a sixtyfold increase in water equivalent total annual melt between the preindustrial period (before 1850 Common Era) and present day. We calibrate the melt record to summer temperatures based on weather station data from the ice core drill site and find that the increase in melt production represents a summer warming rate of at least 1.92 ± 0.31°C per century during the last 100 years, exceeding rates of temperature increase at most low‐elevation sites in Alaska. The Mt. Hunter melt layer record is significantly (p < 0.05) correlated with surface temperatures in the central tropical Pacific through a Rossby wave‐like pattern that enhances high temperatures over Alaska. Our results show that rapid alpine warming has taken place in the Alaska Range for at least a century and that conditions in the tropical oceans contribute to this warming.
 |
| Location of the Mt. Hunter ice core (red triangle) in the Alaska Range, Alaska. Black
circles indicate the locations of other temperature records discussed in the text.
Tree ring study areas are denoted by blue ovals. A photograph of the drill site is
shown in the inset.
|
*****
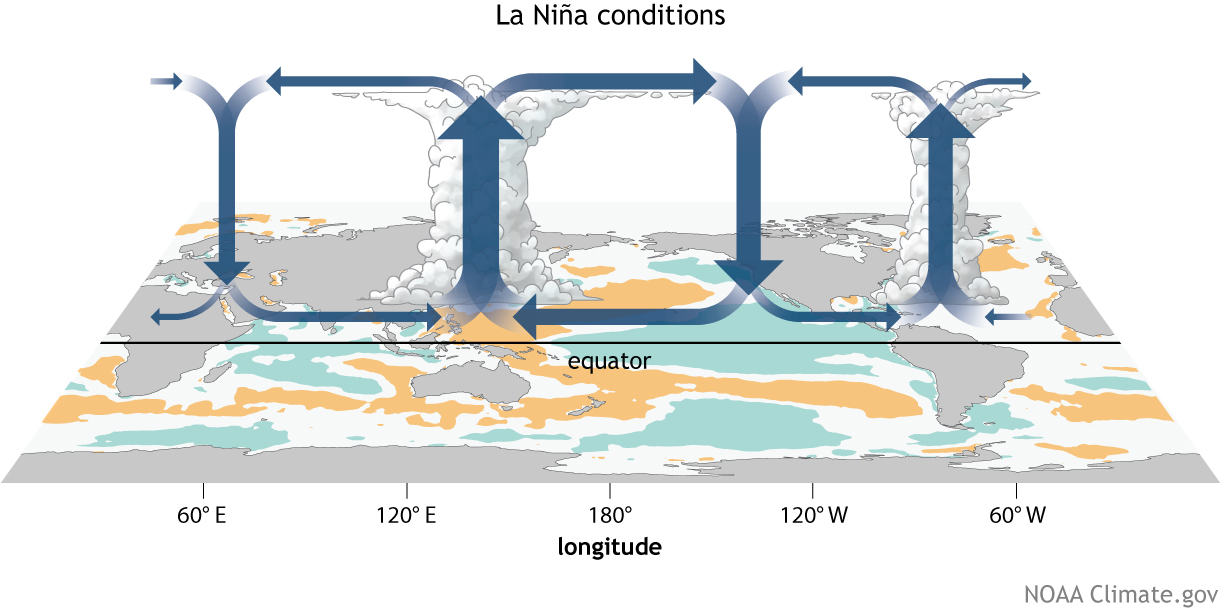
Officially, we're still in La Niña, but it's barely hanging on, which means its
influence on seasonal climate impacts in the U.S. will be weakening. Ocean surface temperatures in the key region of the tropical Pacific rose throughout March and were just below the threshold for neutral conditions for the month as a whole. The bull's-eye of heavier than usual precipitation in Indonesia that is one of
La Niña's calling cards drifted eastward toward its more neutral location.
Conditions are likely to be ENSO-neutral through summer. The next update will be May 10.
 |
| Visualisation du phénomène ENSO sur le Pacifique Est en mars 2018. |
*****
GISS L-OTI anomalies de températures vs 1951-1980
 |
Note: Gray areas signify missing data.
Note: Ocean data are not used over land nor within 100km of a reporting land station. |
 |
| Temperature anomalies of March 2018 according to latitude. |
*****
Coral Reef Watch
 |
| NOAA Coral Reef Watch's most recent
Four-Month Coral Bleaching Heat Stress Outlook. This figure shows the distribution of the
lowest heat stress levels predicted by at least 60% of the model ensemble members. In other words,
there is a 60% chance that the displayed heat stress levels will occur.
|
*****
Climate Prediction Center
 |
| Global Tropics Benefits / Hazards |
*****
The year 2017 finished out with an annually averaged sea ice volume that was the lowest on record with 12,900 km 3 , below 2012 for which the annually averaged volume was 13,500 km3 . This was even though extent and sea ice thickness were at record lows during the early months of 2017 but anomalousy little melt for the recent years (Fig 8), brought the ice volume back above record levels.
Average Arctic sea ice volume in March 2018 was 20,800 km3. This value is the second lowest on record and about 1300 km3 above the previous March record that was set in 2017 with 19,500 km3 . Ice volume was 35% below the maximum in 1979 and 22% below the mean value for 1979-2017.
March 2018 ice volume sits right on the long term trend line.
Ice thickness anomalies 2018 relative to 2011-2017 (Fig 6) are positive in the East Siberian Sea and negative in much of the rest of the Arctic.
Ice thickness is particularly anomalous north of Greenland where a large Polynya opened up during the second half of February due to strong off shore motion (Fig 7) of sea ice brought about by unusual wind patterns. Ice thickness anomalies from CryoSat AWI show very similar overall pattern (Fig 9.) supporting the idea that
ice was thicker that normal over the recent years (2011-2017) along the Siberian coast. This is the result of anomalously large sea ice advection by winds into this area (Fig. 10). This is an example of how anomalous weather can have substantial effects on the large distribution of sea ice thickness in the Arctic. Also notable is the anomalously large sea ice advection along northern shore of Greenland and Ellsmere Island. This is the signature of the “refilling” of the Polynya that opened in this area during the second half of February. More normal, anticyclonic sea ice circulation during March that normally piles up sea ice against the Greenland shore, began filling the Polynya and other areas along the shore that had lost sea ice due to the “whacky winds” in late February of 2018. In this case both sea ice dynamics (ice drift) and thermodynamics regrowth of thin ice help patch the “holes”.
 |
| Fig 8 Comparison of Daily Sea Ice Volume Anomalies relative to 1979-2016. |
 |
| Fig 4.Average Arctic sea ice thickness over the ice-covered regions from PIOMAS for a selection of years. The average thickness is calculated for the PIOMAS domain by only including locations where ice is thicker than .15 m. |
 |
| Fig.1 Arctic sea ice volume anomaly from PIOMAS updated once a month. Daily Sea Ice volume anomalies for each day are computed relative to the 1979 to 2017 average for that day of the year. Tickmarks on time axis refer to 1st day of year. The trend for the period 1979- present is shown in blue. Shaded areas show one and two standard deviations from the trend. Error bars indicate the uncertainty of the monthly anomaly plotted once per year. |
 |
| Fig. 2 Total Arctic sea ice volume from PIOMAS showing the volume of the mean annual cycle, and from 2010-2018. Shaded areas indicate one and two standard deviations from the mean. |
 |
| Fig.3 Monthly Sea Ice Volume from PIOMAS for April and Sep. |
 |
| Fig 6. PIOMAS Ice Thickness Anomaly for March 2018 relative to 2011-2017. |
*****
Arctic Data archive system (ADS)
 |
| Arctic sea ice extent. |
 |
| Antarctic sea ice extent. |
*****
 |
| Et les ours polaires peuvent aussi arrêter de se faire du souci. |
 |
| Les nouveaux index de qualité sous la mandature Trump. |
 |
| En hommage à tous ceux qui croient qu'un peu de neige signifie la fin du réchauffement climatique. |
 |
| Sur l'image de droite il manque les installations pétrolières (sûrement un oubli du dessinateur) |
 |
| Et dire que certains prétendent que ce sont les climatosceptiques qui risquent le bûcher... |
 |
| Un jour viendra, ce rêve se réalisera... |


Aucun commentaire:
Enregistrer un commentaire