Actualité climatique du mois passé dans laquelle j'entrepose pêle-mêle les articles que j'ai trouvés intéressants (mais j'ai pu, et dû, en louper un certain nombre) ; les articles ne sont pas traduits en français, à chacun donc de se débrouiller avec la langue de Shakespeare en fonction de ses capacités (il y a au demeurant des outils de traduction en ligne assez performants...) ; cependant vous pouvez aussi utiliser l'outil de traduction que Blogger met à votre disposition et que vous trouverez dans le bandeau de droite. Sélectionnez d'abord l'anglais si le français n'apparait pas, le texte sera alors intégralement traduit en anglais ; il vous suffira alors de sélectionner le français et tout le texte sera intégralement traduit en français.
*****
Le 2 mars 2018 : Acceleration of phenological advance and warming with latitude over the past century
https://www.nature.com/articles/s41598-018-22258-0
Abstract - In the Northern Hemisphere, springtime events are frequently reported as advancing more rapidly at higher latitudes, presumably due to an acceleration of warming with latitude. However, this assumption has not been investigated in an analytical framework that simultaneously examines acceleration of warming with latitude while accounting for variation in phenological time series characteristics that might also co-vary with latitude. We analyzed 743 phenological trend estimates spanning 86 years and 42.6 degrees of latitude in the Northern Hemisphere, as well as rates of Northern Hemisphere warming over the same period and latitudinal range. We detected significant patterns of co-variation in phenological time series characteristics that may confound estimates of the magnitude of variation in trends with latitude. Notably, shorter and more recent time series tended to produce the strongest phenological trends, and these also tended to be from higher latitude studies. However, accounting for such variation only slightly modified the relationship between rates of phenological advance and latitude, which was highly significant. Furthermore, warming has increased non-linearly with latitude over the past several decades, most strongly since 1998 and northward of 59°N latitude. The acceleration of warming with latitude has likely contributed to an acceleration of phenological advance along the same gradient.
 |
| (A) Variation in the relationship between rate of Northern Hemisphere springtime land surface warming and latitude among successively more recent decadal periods beginning in 1928, coinciding with the periods encompassed by the studies upon which estimates of phenological trends used in this analysis have been based. (B) The mean rate (heavy line) and upper- and lower 95% confidence limits (thin lines) of Northern Hemisphere springtime land surface warming calculated across all periods in panel (A). |
*****
Le 26/02/2018 : Climate Change Trends and Impacts on California Agriculture: A Detailed Review
http://www.mdpi.com/2073-4395/8/3/25/htm
Abstract: California is a global leader in the agricultural sector and produces more than 400 types of commodities. The state produces over a third of the country’s vegetables and two-thirds of its fruits and nuts. Despite being highly productive,
current and future climate change poses many challenges to the agricultural sector. This paper provides a summary of the current state of knowledge on historical and future trends in climate and their impacts on California agriculture. We present a synthesis of climate change impacts on California agriculture in the context of: (1) historic trends and projected changes in temperature, precipitation, snowpack, heat waves, drought, and flood events; and (2) consequent impacts on crop yields, chill hours, pests and diseases, and agricultural vulnerability to climate risks. Finally, we highlight important findings and directions for future research and implementation. The detailed review presented in this paper provides sufficient evidence that the climate in California has changed significantly and is expected to continue changing in the future, and justifies the urgency and importance of enhancing the adaptive capacity of agriculture and reducing vulnerability to climate change. Since agriculture in California is very diverse and each crop responds to climate differently, climate adaptation research should be locally focused along with effective stakeholder engagement and systematic outreach efforts for effective adoption and implementation. The expected readership of this paper includes local stakeholders, researchers, state and national agencies, and international communities interested in learning about climate change and California’s agriculture.
 |
| Figure 2.
The historical and projected maximum temperatures (°F) in California for the period 1950–2099 for Shasta, Sacramento, and Los Angeles County (top to bottom). Left: projection based on Representative Concentration Pathways, RCP4.5 and right: RCP8.5. Extracted from Cal-Adapt interactive web portal [13].
|
 |
| Figure 5.
Snow water equivalent time series for the observed and projected time-period. Extracted from Cal-Adapt interactive web portal [13].
|
 |
| Figure 6.
Historical and projected snow pack for the Sierra Nevada. Adopted from “California Climate Science and Data for Water Resources Management” published by California Department of Water Resources in 2015 [21].
|
 |
| Figure 10.
Crop yield changes associated with future climate scenarios, with yield anomalies from 2000–2003 average yields, in percent, constrained to historical extremes. The black line shows median projections, the dark shaded area shows 90% confidence interval after accounting for climate uncertainty, and the light shaded area shows a 90% confidence interval after accounting for both climate and crop uncertainty [34].
|
 |
| Figure 11.
Crop yield response to warming in California’s Central Valley based on higher emission scenario (A2) and lower emission scenario (B1) [40,41]. Copyright © 2006 Elsevier, Amsterdam, Netherlands.
|
6. Conclusions
This detailed review provides sufficient evidence that climate in California has changed significantly, and this change can be expected to continue in the future. Increased minimum and maximum temperatures, highly variable and shifting precipitation patterns, reduced amount of snowpack in the Sierras, and increased frequency and intensity of weather extremes such as heat waves and drought are examples of climate change indicators for the state. These trends are negatively influencing California’s highly productive agricultural industry. Impacts on agriculture include low chill hour accumulations, crop yield declines, increased pest and disease pressure, increased crop water demands, altered phenology of annual and perennial cropping systems, and uncertain future sustainability of some highly vulnerable crops. The detailed reviews on trends and impacts of climate change on California agriculture justify the importance and urgency for a stronger focus on enhancing the adaptive capabilities of agriculture to reduce vulnerability to climate change and gain substantial benefits. California agriculture is very diverse and since each crop responds to climate differently, climate adaptation research should be locally focused along with effective stakeholder engagement and systematic outreach efforts for more effective adoption and implementation.
*****
Abstract - Recent boreal winters have exhibited a large-scale seesaw temperature pattern characterized by an unusually warm Arctic and cold continents. Whether there is any physical link between Arctic variability and Northern Hemisphere (NH) extreme weather is an active area of research. Using a recently developed index of severe winter weather, we show that the occurrence of severe winter weather in the United States is significantly related to anomalies in pan-Arctic geopotential heights and temperatures. As the Arctic transitions from a relatively cold state to a warmer one, the frequency of severe winter weather in mid-latitudes increases through the transition. However, this relationship is strongest in the eastern US and mixed to even opposite along the western US. We also show that during mid-winter to late-winter of recent decades, when the Arctic warming trend is greatest and extends into the upper troposphere and lower stratosphere, severe winter weather—including both cold spells and heavy snows—became more frequent in the eastern United States.
*****
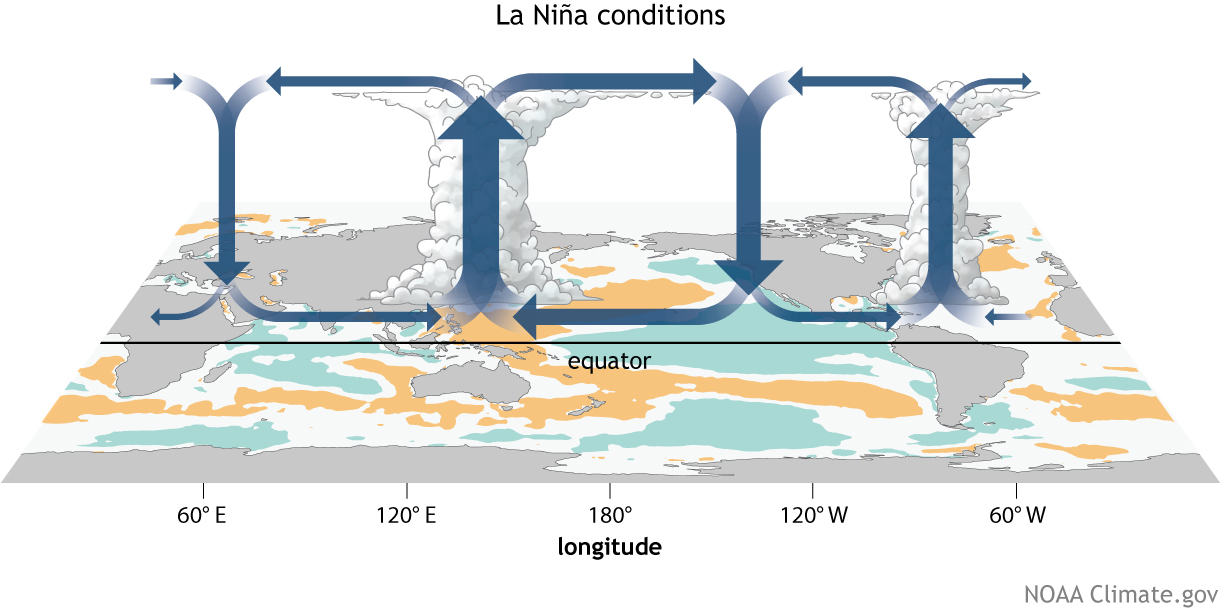
ENSO
La Niña is loosening its grip on the tropics. Sea surface temperatures in the central and eastern tropical Pacific remain cooler than average, but the typical La Niña wind and rainfall anomalies have faded. Conditions are likely (55% chance) to return to neutral by the March-May season. The next update will be on April 12.
 |
| Visualisation du phénomène ENSO sur le Pacifique Est en janvier 2018. |
*****
GISS L-OTI anomalies de températures vs 1951-1980
 |
Note: Gray areas signify missing data.
Note: Ocean data are not used over land nor within 100km of a reporting land station. |
 |
| Temperature anomalies of February 2018 according to latitude. |
 |
| Average surface temperature in 2016 compared to the 1981-2010 average. NOAA Climate.gov map, adapted from Plate 2.1a in State of the Climate in 2016. |
 |
| History of Global Surface temperature since 1880 source noaa |
*****
 |
| NOAA Coral Reef Watch Satellite's Coral Bleaching Alert Area below shows the maximum heat stress During the Third Global Coral Bleaching Event. Experienced Regions That the high heat stress causes coral bleaching That can, from June 1, 2014 to May 31, 2017, are displayed. Alert Level 2 indicates heat stress Widespread coral bleaching and significant mortality. Alert Level 1 indicates significant heat stress coral bleaching. Lower levels of stress May-have Caused Some bleaching as well. More than 70% of coral reefs around the world Experienced the heat stress That can causes bleaching and / or mortality During the three-year long global event. |
*****
Climate Prediction Center
 |
| Global Tropics Benefits / Hazards |
*****
The year 2017 finished out with an annually averaged sea ice volume that was the lowest on record with 12,900 km 3 , below 2012 for which the annually averaged volume was 13,500 km3 . This was even though extent and sea ice thickness were at record lows during the early months of 2017 but anomalousy little melt for the recent years (Fig 8), brought the ice volume back above record levels.
Average Arctic sea ice volume in February 2018 was 18,600 km3 . This value is about 1300 km3 above the previous February record that was set in 2017 with 17,300 km3 . Ice volume was 38% below the maximum in 1979 and 24% below the mean value for 1979-2017. February 2018 ice volume sits right on the long term trend line.
February sea ice volume is above of the previous record despite the fact that February 2018 sea ice extent is tracking near record lows. This is because ice thickness according to PIOMAS is up from 2018 by about 10 cm. Ice growth during February 2018 was substantially slower than in previous years (Fig 8). A relative increase in ice thickness over 2017 is also shown in CryoSat data.
Ice thickness anomalies for February 2018 relative to 2011-2017 (Fig 6) are positive in the East Siberian Sea and negative in much of the rest of the Arctic. Ice thickness is particularly anomalous north of Greenland where a large Polynya open up during the second half of February due to strong off shore motion of sea ice brought about by unusual wind patterns.
 |
| Fig 8 Comparison of Daily Sea Ice Volume Anomalies relative to 1979-2016. |
 |
| Fig 4.Average Arctic sea ice thickness over the ice-covered regions from PIOMAS for a selection of years. The average thickness is calculated for the PIOMAS domain by only including locations where ice is thicker than .15 m. |
 |
| Fig.1 Arctic sea ice volume anomaly from PIOMAS updated once a month. Daily Sea Ice volume anomalies for each day are computed relative to the 1979 to 2017 average for that day of the year. Tickmarks on time axis refer to 1st day of year. The trend for the period 1979- present is shown in blue. Shaded areas show one and two standard deviations from the trend. Error bars indicate the uncertainty of the monthly anomaly plotted once per year. |
 |
| Fig. 2 Total Arctic sea ice volume from PIOMAS showing the volume of the mean annual cycle, and from 2010-2018. Shaded areas indicate one and two standard deviations from the mean. |
 |
| Fig.3 Monthly Sea Ice Volume from PIOMAS for April and Sep. |
 |
| Fig 6. PIOMAS Ice Thickness Anomaly for February 2018 relative to 2011-2017. |
*****
Arctic Data archive system (ADS)
 |
| Arctic sea ice extent. |
 |
| Antarctic sea ice extent. |
*****
 |
| Une solution efficace pour combattre le réchauffement climatique : celle choisie par Donald Trump ! |
 |
| Peut-on dire que l'accord de Paris l'a dans le cul de Trump ? |
 |
| Oui, la bêtise humaine a encore de beaux jours devant elle... |


